Why Choose ManageEngine OpManager for Enterprise Network Monitoring?
Real-Time Network Monitoring Made Simple
ManageEngine OpManager is a comprehensive network monitoring solution trusted by over 1 million IT admins worldwide. It ensures high network availability, delivers deep visibility into performance, and identifies issues proactively—reducing downtime and improving operational efficiency.
-
Monitors over 3,000 network metrics.
-
Covers switches, routers, servers, firewalls, and interfaces.
-
Designed for hybrid and multi-vendor environments.
Comprehensive Device and Infrastructure Monitoring
Hybrid Network Support
OpManager monitors Microsoft Hyper-V, VMware, Citrix XenServer, Nutanix, and Cisco UCS infrastructures. It also tracks critical applications such as Exchange, Active Directory, and core services for performance and faults.
Real-Time Alerts and Automation
-
Proactive fault alerts via SMS, email, Slack, and ticketing systems.
-
100+ no-code workflows automate repetitive IT tasks.
-
Reduces Mean Time to Repair (MTTR) significantly.
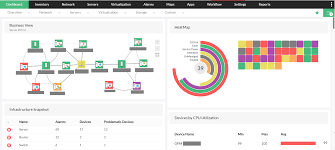
Intuitive Dashboards and Visualization Tools
Unified Monitoring Interface
Gain visibility with over 350 dashboard widgets. Use color-coded alerts and multi-threshold settings to prioritize critical issues.
-
3D Floor Views and Rack Views for physical layouts.
-
Layer 2 Maps and Google/Zoho Maps for geographical visualization.
-
VM Maps for virtual infrastructure insights.
Advanced Fault and Performance Management
Detailed Notifications and Integrations
-
Custom alert profiles for specific devices or conditions.
-
Integration with Jira, ServiceNow, Teams, and other tools.
-
REST API for custom data workflows.
Intelligent Automation
-
Discovery Rule Engine for auto-classifying devices.
-
Auto-apply templates and monitoring profiles on discovery.
-
Reduces manual configuration efforts dramatically.
Exclusive Monitoring Features
Root Cause Analysis (RCA)
Visualize, analyze, and correlate monitoring data in one place.
-
Accelerates identification of network issues.
-
Centralized console for device, interface, and URL data.
Adaptive Thresholds
-
Uses ML-based predictive algorithms to adjust alert thresholds dynamically.
-
Reduces false alarms and enhances monitoring accuracy.
Security and Specialized Monitoring
-
SNMPv3 with SHA-2 authentication for secure monitoring.
-
Cisco ACI and Meraki infrastructure monitoring.
-
Wireless LAN controller and Cisco switch stack monitoring.
Scalable and Flexible Deployment
Enterprise-Grade Scalability
-
Monitors up to 30,000 devices and 50,000 interfaces.
-
Supports multi-site monitoring with high availability failover.
-
Centralized console for branch office monitoring.
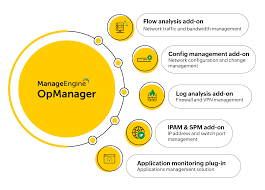
Add-Ons and Plug-Ins
Expand OpManager with integrated modules:
-
Applications Manager: Code-level app performance monitoring.
-
NetFlow Analyzer: Bandwidth usage and traffic analysis.
-
Firewall Analyzer: Policy and security log analysis.
-
Network Configuration Manager: Real-time configuration tracking.
-
IPAM & SPM: IP address and switch port management.
Mobile and On-the-Go Monitoring
Monitor your IT infrastructure from anywhere using OpManager’s iOS and Android apps. Stay connected to real-time alerts and dashboards.
Conclusion: Unified Network Monitoring for Maximum Uptime
ManageEngine OpManager delivers complete network visibility, advanced automation, and scalable performance for enterprises. It simplifies monitoring, strengthens security, and supports hybrid IT environments—making it the ideal choice for proactive IT operations.
ManageEngine OpManager – Network & Infrastructure Monitoring (KYS Infotech)
OpManager Datasheet (PDF)